
![]() ∥
∥ ![]() ∥ 中研院 ∥ 人社中心 ∥ 繁體中文 ∥ English
∥ 中研院 ∥ 人社中心 ∥ 繁體中文 ∥ English
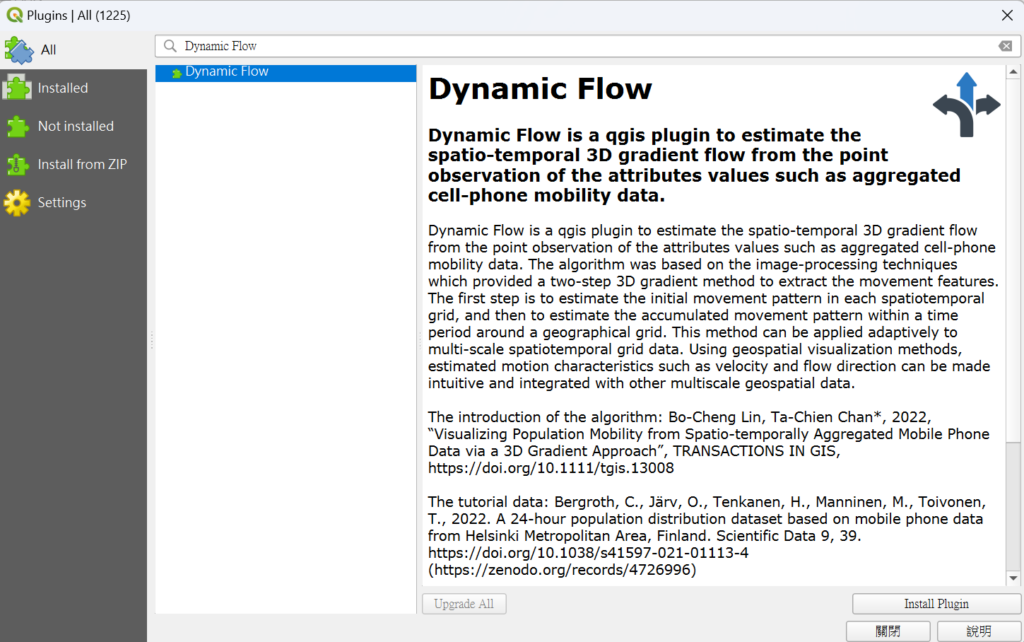
Dynamic Flow是QGIS軟體外掛程式用於估算時空梯度流,基於點資料的屬性值,例如加總後的手機移動數據。
Dynamic Flow is a QGIS plugin to estimate the spatio-temporal 3D gradient flow from the point observation of the attributes values such as aggregated cell-phone mobility data.
Dynamic Flow的演算法介紹可以參考以下論文:
For an introduction to the algorithm of Dynamic Flow, please refer to the following paper:
Bo-Cheng Lin, Ta-Chien Chan*, 2022, “Visualizing Population Mobility from Spatio-temporally Aggregated Mobile Phone Data via a 3D Gradient Approach”, TRANSACTIONS IN GIS
https://doi.org/10.1111/tgis.13008
一、安裝Dynamic Flow外掛程式: 在QGIS軟體主選單上[Plugins] -> [Manager and install Plugins …]直接搜尋Dynamic Flow並安裝。
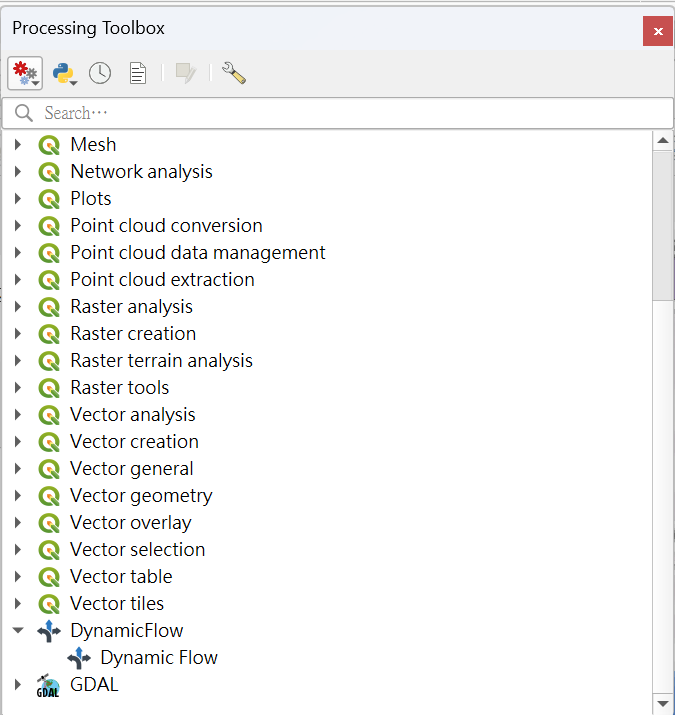
二、安裝完成後,可以透過主選單 [Processing] -> [Toolbox] 找到Dynamic Flow工具
三、練習資料可以從以下論文下載:
The tutorial data can be download from following paper:
Bergroth, C., Järv, O., Tenkanen, H., Manninen, M., Toivonen, T., 2022. A 24-hour population distribution dataset based on mobile phone data from Helsinki Metropolitan Area, Finland. Scientific Data 9, 39. https://doi.org/10.1038/s41597-021-01113-4 (https://zenodo.org/records/4726996)
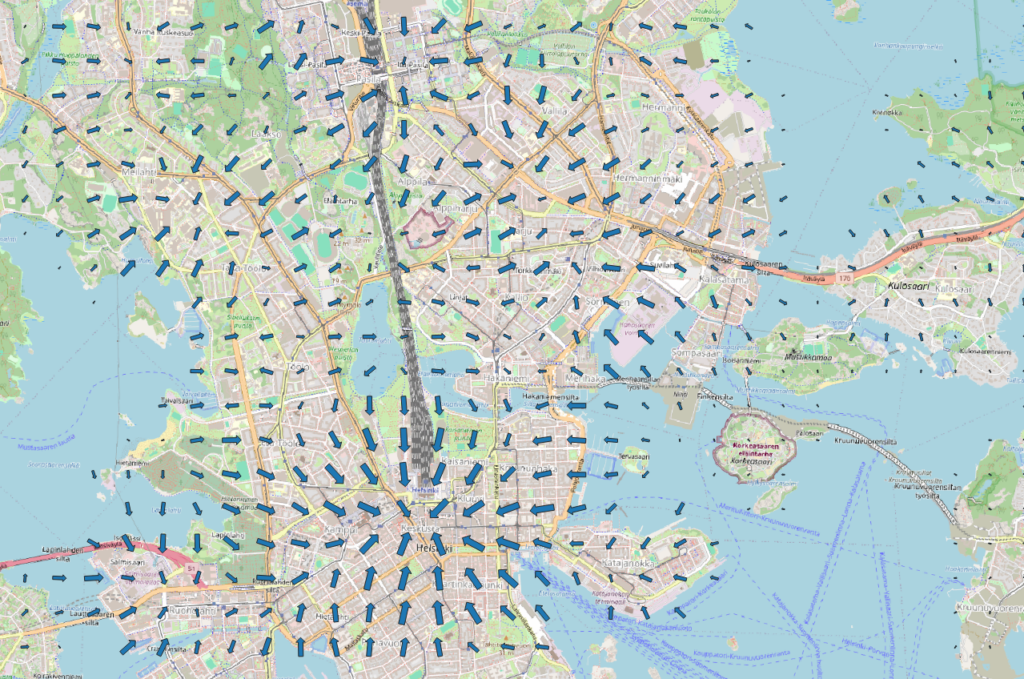
四、以下為Dynamic Flow工具操作範例
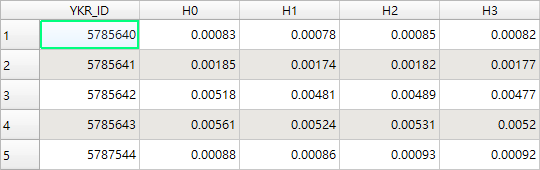
輸入資料所需內容
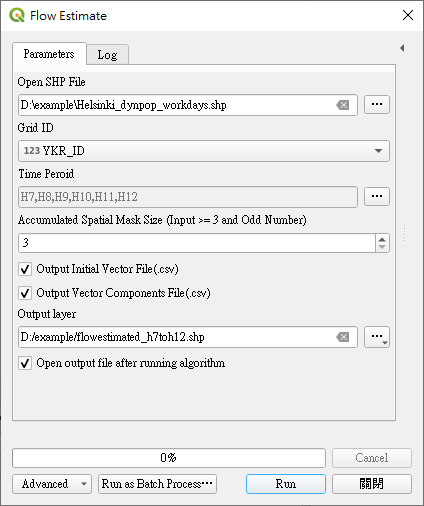
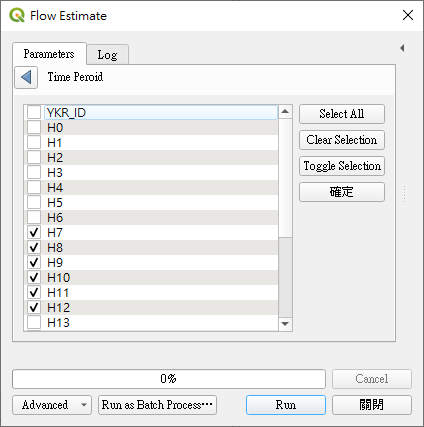
使用者介面參數設定
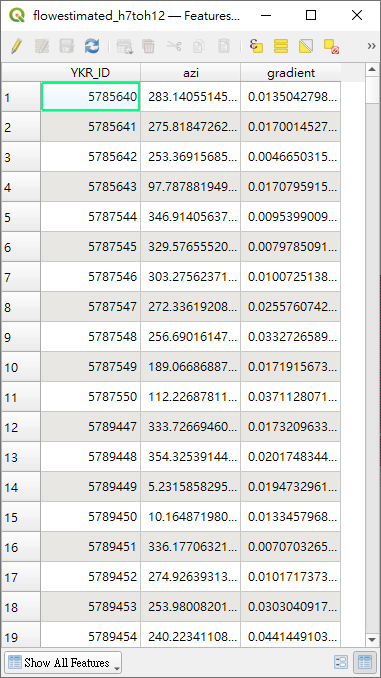
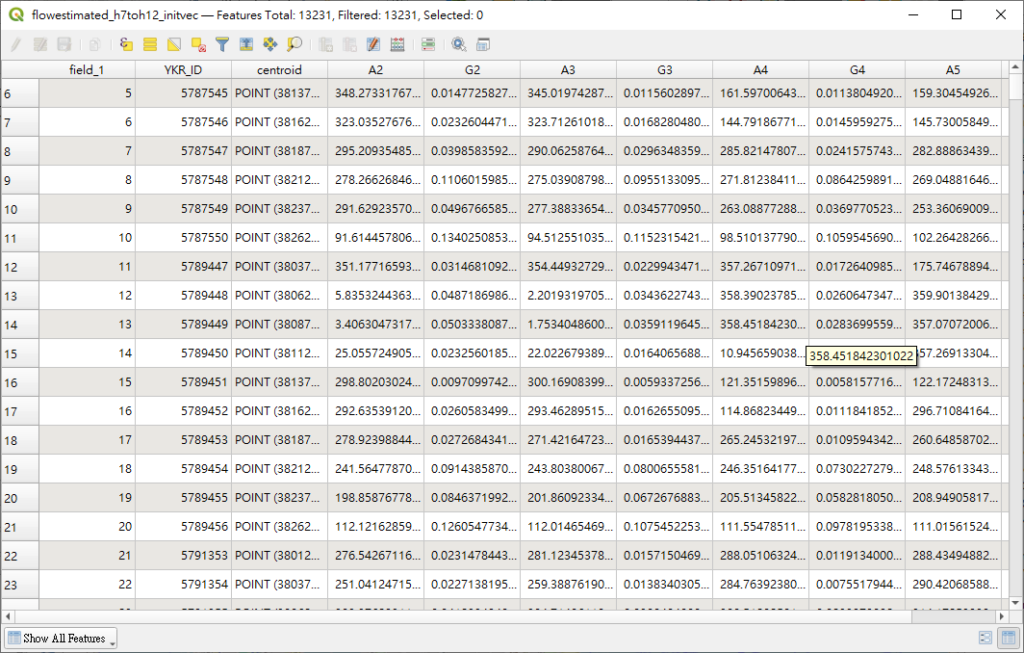
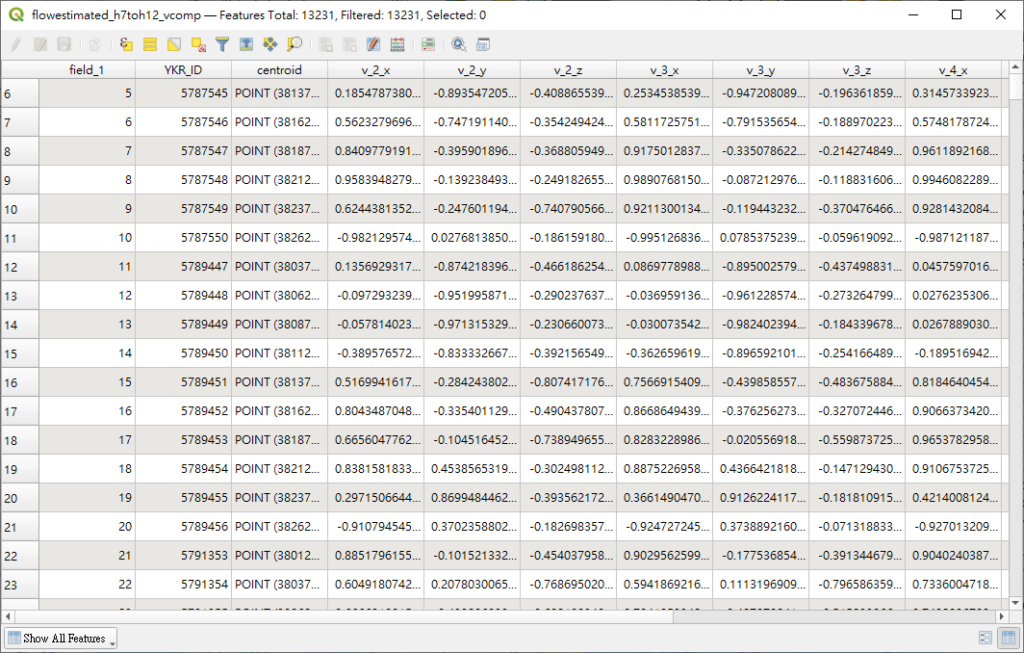
輸出資料說明
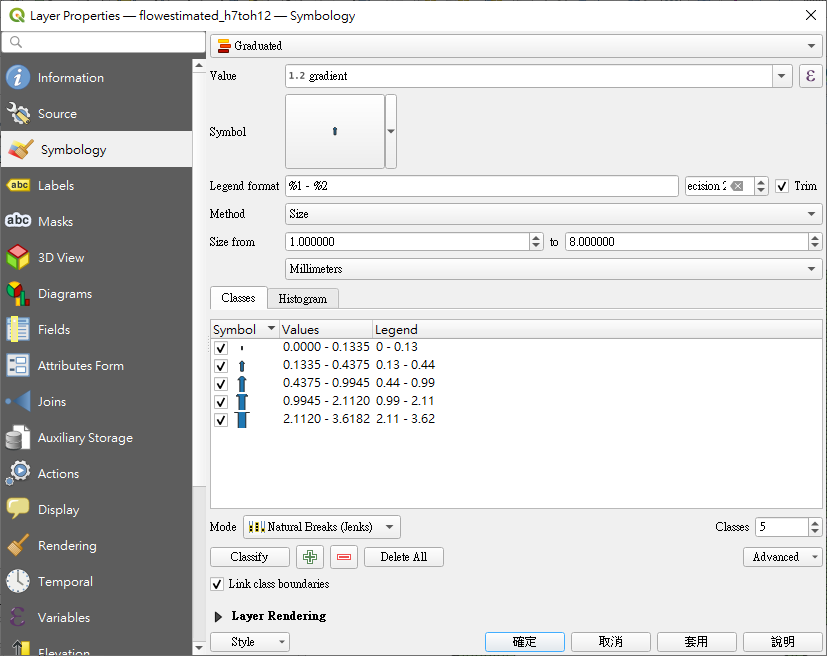
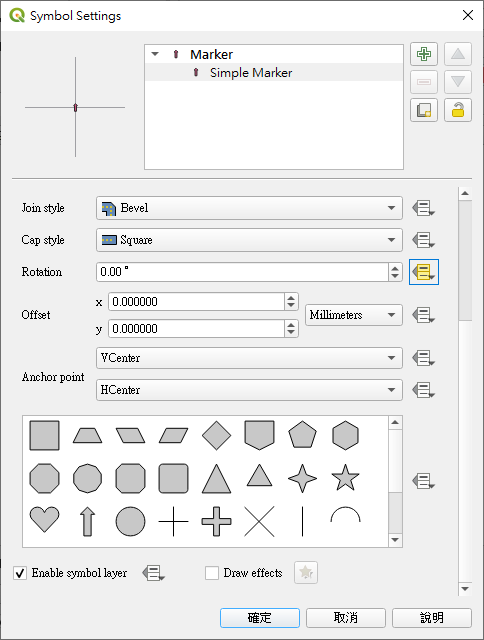
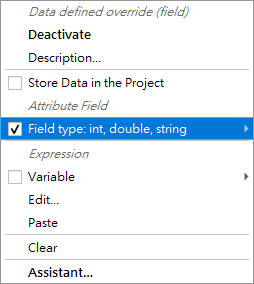
展示符號設定

參考文件: