首頁 > QGIS, Uncategorized, 操作功能 > QGIS近鄰分析(Nearest Neighbor Analysis)功能

QGIS近鄰分析(Nearest Neighbor Analysis)功能

2016年1月5日 發表評論 閱讀評論

在空間分析方法中有一種近鄰分析(Nearest Neighbor Analysis),主要來度量點資料圖層在空間分布上是否有隨機、規則或群聚分布現象;近鄰分析的計算方式與指標也有相當多種,QGIS 2.8版以上內建提供近鄰指標(Nearest Neighbor Index)計算。

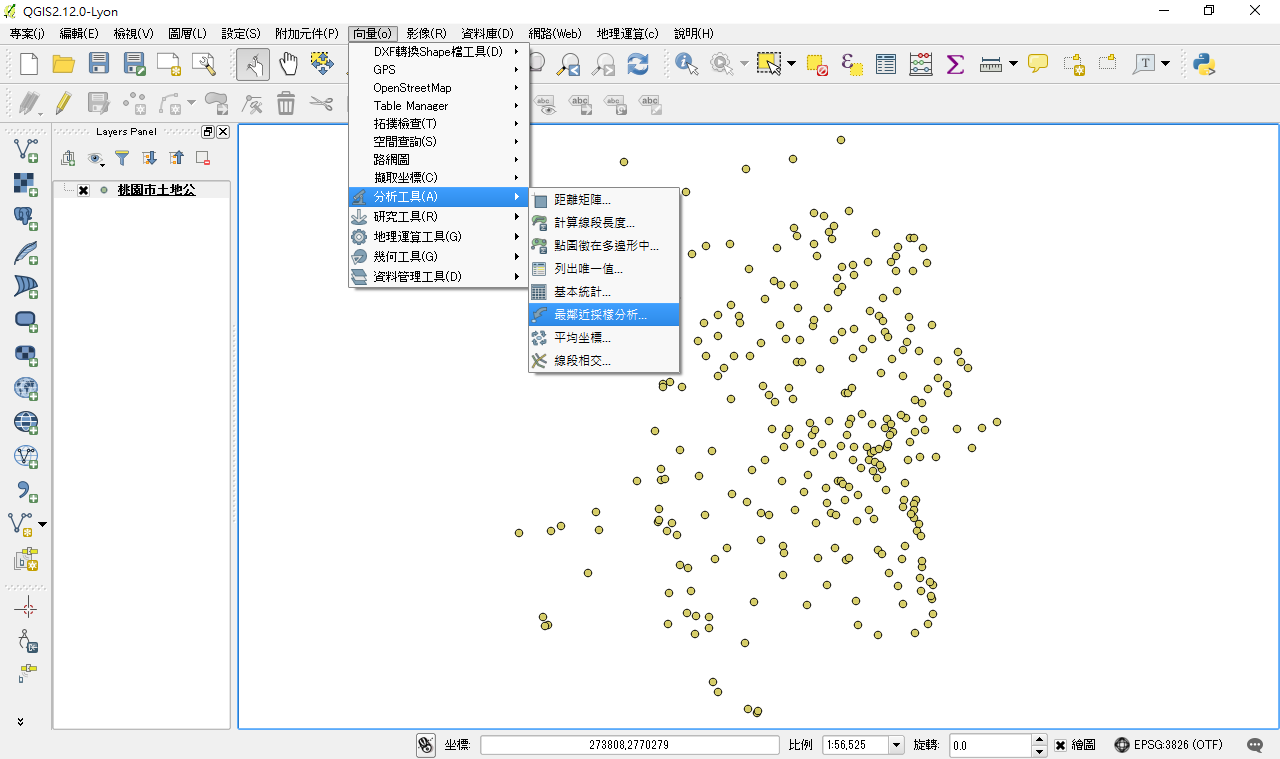
向量->分析工具->最近鄰採樣分析(Nearest Neighbor Statistics):
螢幕截圖 2016-01-05 10.18.56

計算公式如下:

Average Nearest Neighbor = Distance / # Points
Expected Avg Nearest Neighbor = (1/2)( Sqr Root (Area/ # Points))
Z score = (Avg NN – Expected Avg NN ) / Standard Deviation

螢幕截圖 2016-01-05 10.20.16

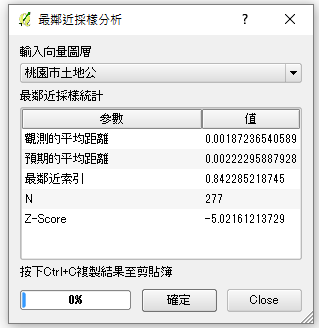
Z score負值表示有群聚現象、正值表示離散現象,數字越大則現象越明顯。

Categories: QGIS, Uncategorized, 操作功能 Tags:
  1. 目前尚無任何的評論。
  1. 2019年12月31日05:46 | #1
  2. 2020年1月17日05:41 | #2
  3. 2020年1月25日23:26 | #3
  4. 2020年1月26日00:03 | #4
  5. 2020年1月29日03:45 | #5
  6. 2020年2月10日18:14 | #6
  7. 2020年2月16日18:54 | #7
  8. 2020年2月17日16:28 | #8
  9. 2020年2月17日17:03 | #9
  10. 2020年2月21日05:53 | #10
  11. 2020年2月28日03:38 | #11
  12. 2020年3月4日17:31 | #12
  13. 2020年3月10日00:22 | #13
  14. 2020年3月10日01:06 | #14
  15. 2020年3月10日19:47 | #15
  16. 2020年3月10日22:44 | #16
  17. 2020年3月16日19:08 | #17
  18. 2020年3月18日18:07 | #18
  19. 2020年3月19日03:47 | #19
  20. 2020年3月21日03:42 | #20
  21. 2020年5月13日18:52 | #21
  22. 2020年5月14日01:11 | #22
  23. 2020年7月17日17:55 | #23
  24. 2020年7月22日04:54 | #24
  25. 2020年8月11日03:55 | #25
您必須 登入 後才能發表評論。